
How to Analyze & Optimize Unreal Engine’s Game Servers with Server Profiling

What is Server Profiling in Unreal Engine?
Server profiling is the process of collecting and analyzing performance data from a dedicated game server in order to understand how it consumes critical resources such as CPU, memory, and network bandwidth.
In Unreal Engine, server profiling provides visibility into how systems like physics, AI opponents, and replication behave under real multiplayer load. The goal is to identify performance bottlenecks and limits, and stability risks before they impact players or production infrastructure.
Server profiling process typically helps developers answer questions such as:
Which actors consume most memory, how memory scales with amount of actor instances, over time or per player, and what conditions could lead to out-of-memory (OOM) crashes?
Which functions or features are consuming most CPU cycles, and why (for example, player count, tick rate, AI, physics, or replication)?
Which features dominate per-tick resource cost, and how changes to tick rate affect gameplay quality, simulation stability, and network usage?
What causes network jitter, latency spikes, or server-side desynchronization?
How to Profile Servers in Unreal Engine & Best Server Profiling Tools?
Epic Games provide any Unreal Engine users with profiling tools that can be used with Edgegap:
Unreal Trace Server
Unreal Trace Server is the “collector” of server profiling data.
It's a lightweight service that collects, stores, and optionally streams trace data emitted by Unreal Engine applications during runtime.
It enables tools like Unreal Insights to connect to running servers or recorded sessions to analyze the CPU, memory, networking, and asset loading behavior in real time or offline.
How to use it with Edgegap:
Configure tracing in your Unreal Engine server (built-in and custom events).
Save trace on the server disk with -tracefile, upload to 3rd party storage and analyze offline;
Alternatively, stream trace data with Edgegap’s Deployments during dev testing for internal port 1981 over UDP protocol.
Unreal Insights
Unreal Insights is the “viewer” of server profiling data.
In detail, it is Unreal Engine’s performance analysis and visualization tool for examining trace data captured from running applications and servers.
It allows developers to analyze CPU execution, threading, memory usage, asset loading, and networking behavior to identify bottlenecks and scalability issues.
How to use it with Edgegap:
Analyze Memory Insights and Networking Insights.
Leverage these insights to Optimize Server Builds and runtime resources usage.
Edgegap’s Container Logs
Available within your game server deployment’s detail page, read Unreal Engine logs to find and troubleshoot server errors, and follow stack trace with Unreal Engine debugging symbols to identify problematic code.
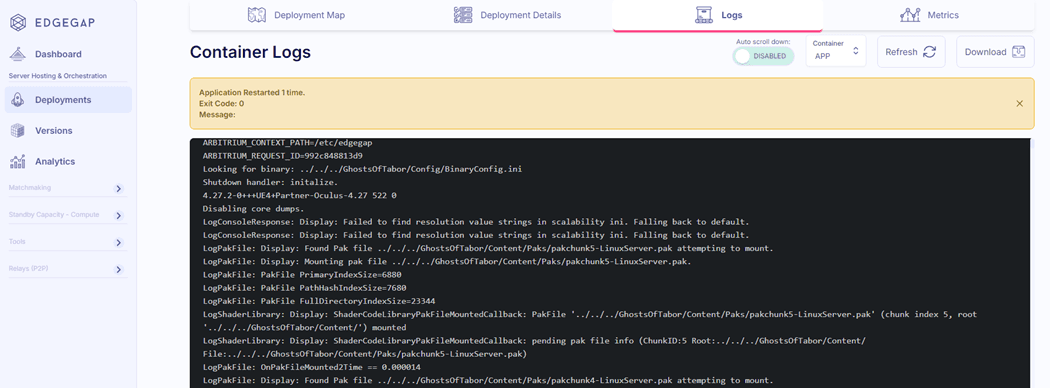
Warning: Once deployment stops, container logs are deleted. Set up third party S3 log storage to save logs.
Review container metrics (processor, memory, networking) to:
identify common connection issues when troubleshooting;
detect inefficient implementation patterns causing spikes in resource usage;
pinpoint inefficient resource usage in particular scenarios;
verify changes in your server’s resource usage during optimization;
benchmark your server initialization resource consumption and duration.
Edgegap create a unique identifier for each deployment, allowing you to exactly track performance usage and link players and testers report to the deployment and track resources (live or post match)
Edgegap’s Container Metrics
Also available within your game server deployment’s detail page, container metrics (as the name implies) provide performance data of your container across processor, memory, networking.
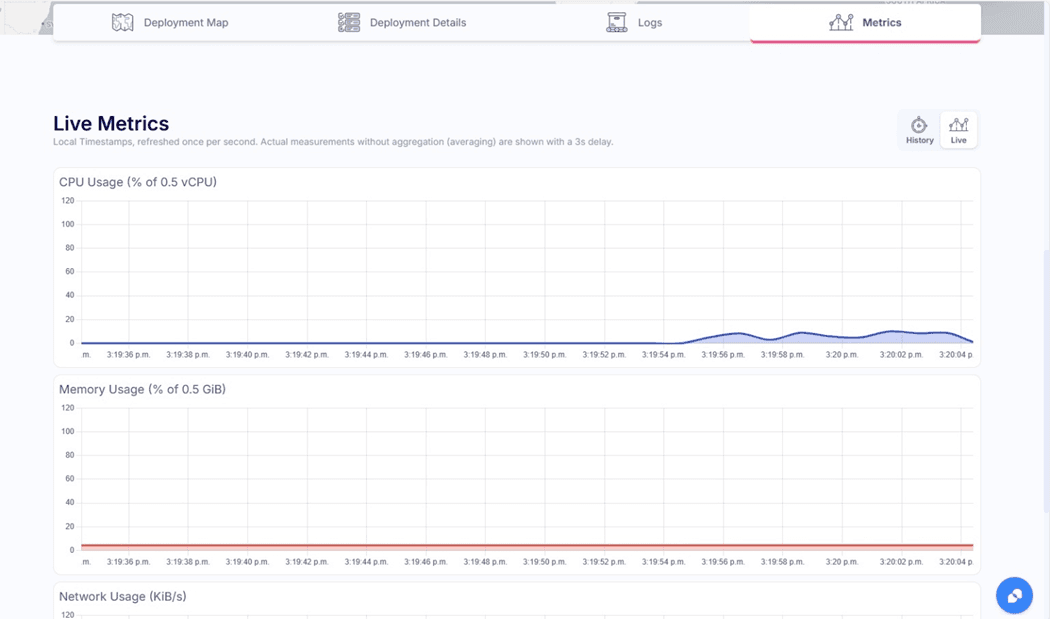
Note: History metrics display value averages with 1 minute time period, available in Free tier. Upgrade to Pay as you Go and unlock raw unaggregated real time metrics with 1 second reporting interval.
Edgegap’s Dashboard Monitoring
Edgegap’s Dashboard provides you with the ability to monitor your server scalability with in-depth analytics.
Available for users who upgrade to the Pay as you Go (just add a credit card to your free account, no spend required) it provides insights on:
General Insights: monitor releases with live server count per version + resource usage overview.
CPU Insights: troubleshoot lagging servers due to processor-heavy operations.
Memory Insights: mitigate server restarts due to exceeding allocated memory.
Networking Insights: detect inefficient networking patterns and optimize netcode.
What Resource to Evaluate in Server Profiling and Why
Ultimately, reducing resource usage of your dedicated game servers means 1. Improves stability and your players’ experience and 2. Lower your cloud computes costs.
It is key to assess each of the following elements and review, based on your tests and unique situation, what you should spend time optimizing.
Note: there’s obviously more, but the following checklist is to help you get started with your server profiling process.
How to A/B Test
Set up two or more variants of the game addressing particular performance issue.
Serve new variants to a small subpopulation of your game, using your game backend segmentation.
Compare normalized metrics and statistical significance to quantify improvement in each variant.
Iterate on optimization, prepare new variants, and validate against performance targets.
CPU Insights
Objective: Reduce CPU usage to allow higher player count, higher tick rate, or smaller instance sizes.
What to review:
Identify high-cost subsystems per tick (AI, physics, replication, gameplay logic).
Adjust servers tick rates to balance simulation fidelity vs. CPU load.
Check for thread contention or stalled tasks in the Task Graph.
Optimize heavy loops or per-tick events.
Memory Insights
Objective: Minimize memory footprint and prevent OOM crashes, enabling denser server packing.
What to review:
Monitor persistent allocations (UObjects, large arrays).
Optimize object pooling:
Track transient allocations and reduce temporary object churn.
Evaluate garbage collection frequency and duration.
Ensure memory usage scales linearly with player count.
Reduce model and texture fidelity for distant or otherwise unimportant actors.
Consider Hierarchical Static Instanced Meshes to reduce crowd simulation resource usage.
Bake textures and animations into a single material to reduce memory footprint.
Network Usage Insights
Objective: Reduce egress usage, eliminate lag, and improve stability to support more concurrent players.
Profile data volume of replicated actors and properties; remove unnecessary updates.
Optimize data types to reduce packet size where possible.
Implement delta replication and compression with snapshot replication as fallback in case of desync.
Reduce bandwidth spikes when players join or perform actions by consolidating multiple actions which can't occur separately in a single parametrized Remote Procedure Call.
Tick Time & Frame Stability
Objective: Maintain stable tick rates to avoid CPU spikes and network desyncs.
Asset & I/O Usage
Objective: Reduce runtime I/O spikes that indirectly impact CPU and networking performance.
What to review:
Profile asset streaming and runtime loading.
Monitor serialization cost for replication and save/load operations.
Reduce disk I/O spikes that can affect the CPU/network.
Written by
the Edgegap Team


